Performance Testing with TestCafe
Why test performance in TestCafe instead of timing curl execution? Mostly because measuring in a real browser can give you a lot more information than just network response time. You can read detailed explanations of all timestamps captured into the window.performance.timing object, detect slow running scripts or huge DOM trees (taking a long time to parse) and more. Without the browser actually parsing, compiling and rendering a page, you are not able to do this — and it will surely affect your users nowadays when webpages are well over 3MB on average.
Helpers
When writing a previous part of this series, we found a bug with TestCafe that we reported. A TestCafe team member replied very quickly showing a simple workaround, so we added getPerformanceMetrics to our npm package @platform-os/testcafe-helpers to abstract the workaround for now and add a couple computed values to help.
If you don't want to use it as a dependency, take a look at this implementation. In this post we will show you the example code that’s using it to make it shorter and to the point.
What to test
Having a whole list of events at your disposal can be overwhelming, so we decided to include some computed values that should help you get started. Raw values are also included, just in case you want to decide for yourself.
We think the most important aspects to measure are:
- Time To First Byte (ttfb): How fast the server starts responding.
- Processing (processing): After everything has been downloaded, how long until the load event is completed.
- DOM ready (domReady): How long did the browser have to wait until it had everything ready to start applying CSS, external JS and other lower priority resources (images, fonts).
Continuous Integration vs local — differences in speed
Keep in mind that when running real browsers, performance is affected by network speed and the computing power of the machine running the tests.
CI tests report smaller numbers, because:
- They are hosted on the same cloud provider as the webpage being tested (ultimately it is a LAN).
- The machine is much faster than your laptop.
Remember this when setting thresholds for network speed metrics — because of these differences, you might want to consider turning off network tests when running locally (we do it by using environment variable CI=true on CI) or having two different sets of values (configuration) for CI vs local environments. Keep in mind that “local environment” means something else for everyone. Everyone has different hardware, different system load, different network connection, a different set of dependencies installed in their OS and different OS — which means results can vary greatly on top of usual project performance instability.
Example
This example demonstrates the differences between testing on your local environment vs in CI.
import { getPerformanceMetrics } from '@platform-os/testcafe-helpers';

fixture('Homepage').page('https://documentation.platformos.com');

test('Page is not too slow', async t => {
  const perf = await getPerformanceMetrics({ t });
  const computed = perf.computed;

  console.log(`TTFB: ${computed.ttfb} ms - DOM Ready: ${computed.domReady} ms`);

  await t.expect(computed.ttfb).lt(1000);
  await t.expect(computed.domReady).lt(2000);
});
This test will fail if TTFB was after 1 second. It will also fail if the DOM ready event was after 2 seconds.
The results on my laptop with an average wifi connection (max 500kB/s, ~60ms latency):
Homepage TTFB: 161 ms - DOM Ready: 239 ms ✓ Page is not too slow
The results on CI (which is on the same provider as the servers):
Homepage TTFB: 7 ms - DOM Ready: 43 ms ✓ Page is not too slow
This shows that timings on my laptop are much slower because of differences in location and network speed.
Make sure you run your tests consistently on similar devices so that you don’t assert results from a high-end machine with a low-end machine on a slow connection. Otherwise, you will either have false negatives or your tests won’t catch regressions when they happen. If you want to, you can resign from asserting altogether and just log the values to your Slack channel and keep an eye on them. You can also gather them, which we will circle back to at the end of this post.
You can use this technique with remote browsers using various devices (e.g. an old smartphone) to test if your web page is rendering fast enough on other devices. It is possible to enable device emulation on chromium-based browsers. Emulation is not the real deal, but it’s better than nothing.
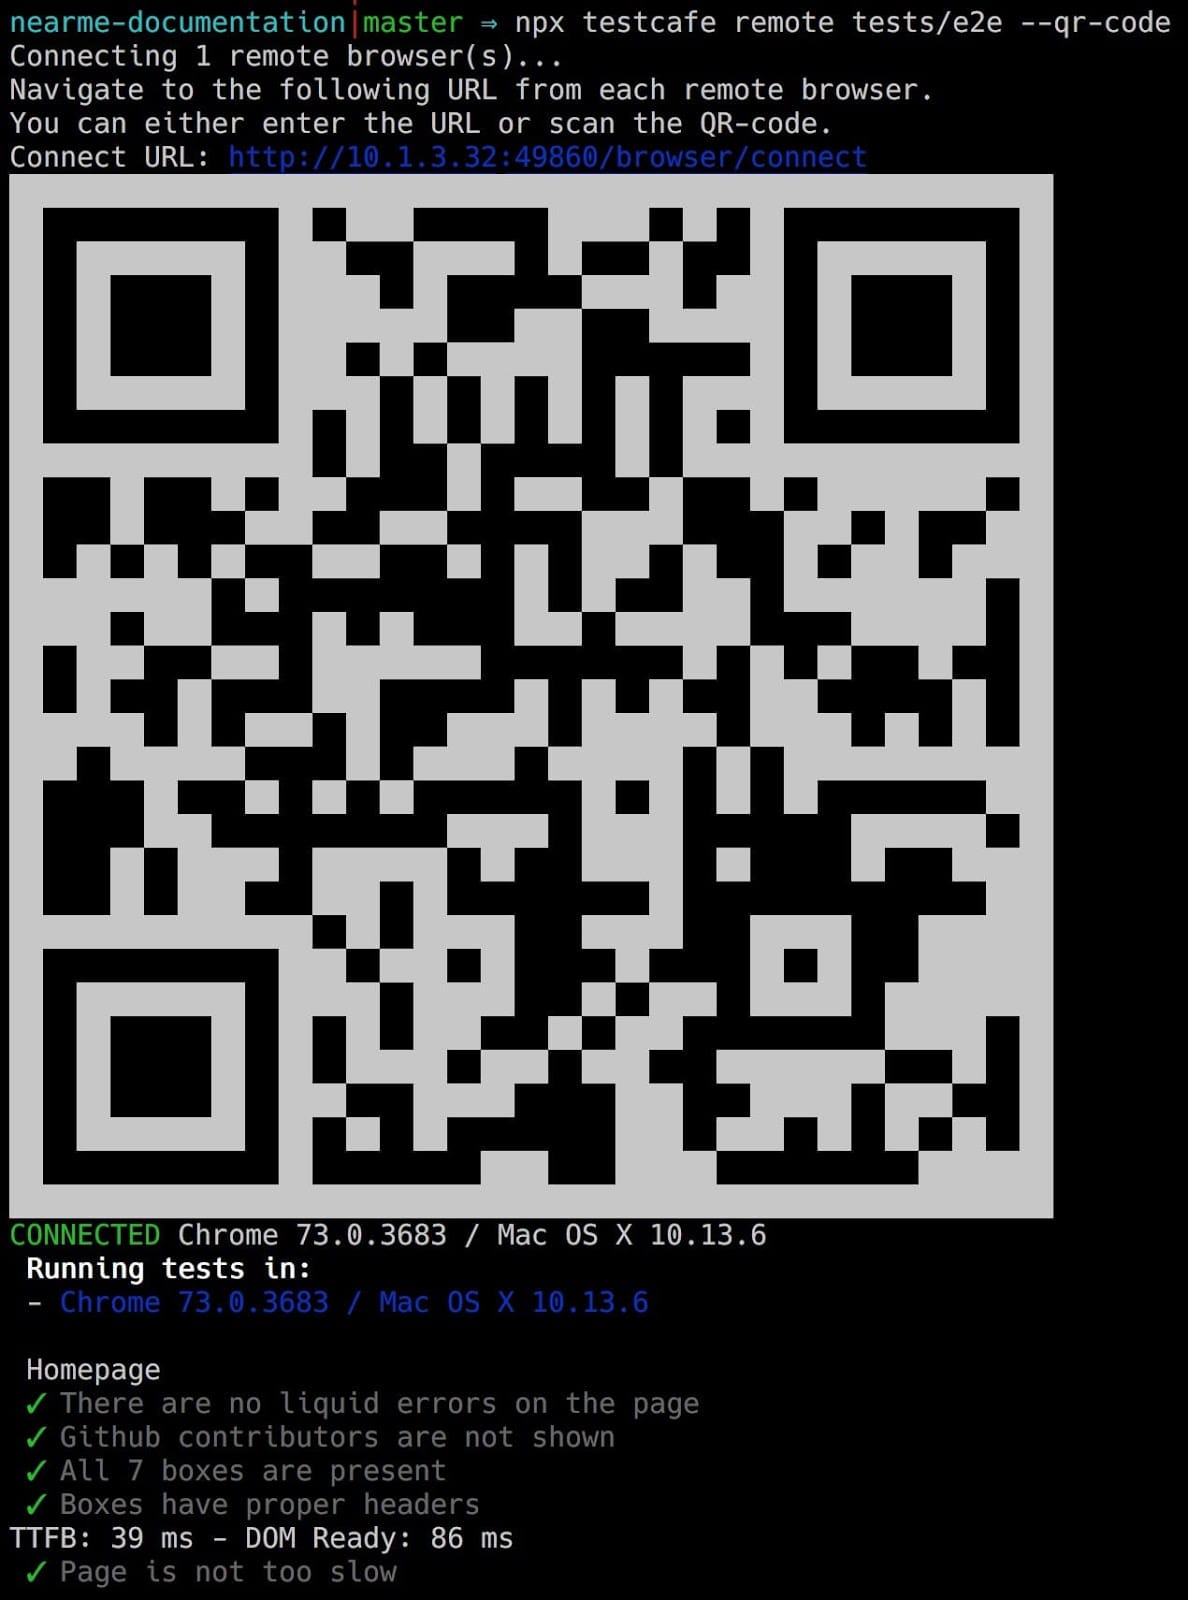
Remote browsers — real devices for the rescue
Ideally, you have your own process handled by Continuous Integration. Having said that, TestCafe supports remote browsers which allow you to run your tests either using browsers provided by BrowserStack / SauceLabs or any other supported browsers that you can get your hands on. This is especially helpful if you need cross browser testing on real devices and specific operating system versions, e.g. iPhone 7 with Mobile Safari or Google Pixel with Firefox on Android 8.
Cloud browsers
Both BrowserStack and SauceLabs have trial accounts for you to explore the pros and cons.
We tested TestCafe with BrowserStack and it was a very good experience, and we will certainly use it in the future for mobile testing.
We collected a couple of links from the official TestCafe documentation to help you get started:
Your own browsers
Using your own browsers to test is even easier. Keep in mind that the device that you are opening the website on has to be in the same network, as the IP is local.
Long term analysis
Comparing how long something should take to how long it actually took is a great way to catch performance regressions, but it is only part of the story. We think it’s also important to observe trends in time when it comes to performance, as it is a constant process of improvements and compromises.
By having remote browsers (devices) at your disposal, you can monitor your application on both desktop and mobile. On fast and slow connection. On a high-end and a low-end mobile phone. Your priorities (and hopefully data-driven choice) will dictate what will give you the most useful data.
To have a trend, you need data series gathered across a time period. You can visualize it on a chart and check if you are going in the right direction with your development.
Keep in mind that:
- TestCafe is just a bunch of JavaScript, so you can run whatever you want in there, for example, post a form to your server, or save a file on your storage provider.
- There are many reporters, including JSON and TAP.
There are many ways to store, format and visualize your test results over time. When we decide to experiment with that, we will probably go with one of the simpler approaches:
- Pick the set of measurements to track (we think time to interactive and time to first byte are good candidates).
- Save JSON reports to a private S3 bucket.
- Schedule AWS Lambda to aggregate results once a day. This will create a final JSON file and save it to the public S3 bucket. It will contain data points with a 1-day resolution.
- The project will have a password protected site that uses simple charts (like Chart.js) as a visualization library and JSON from the public S3 bucket as an asynchronously loaded data source.
With a little bit of work, you can add your application version to the report, or maybe even deploy dates, to know which release had what impact on the application. Something like git commit sha can save you a lot of time when you get performance regression you want to hunt down and fix.